
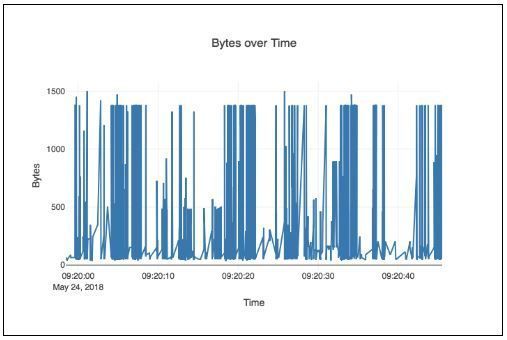
If you have read Part 1 and Part 2 of the Visualizing Network Data with Python posts you have probably noticed one missing piece of data; graphing data over time. At first this might seem very easy - just create a list of timestamps and bytes and you are done. The problem is that you will have thousands of packets which are hard to view and most of them will be at or close to your max MTU (usually 1500 bytes). It would look something like this and not be very helpful:
So the next thought is to group the data into bins of a set time. Which is easy to do if you use the Pandas library in your code. The first step is to install Pandas:
pip3 install pandas
Building on our last example you will import Scapy, Plotly and datetime along with pandas.
from scapy.all import *
import plotly
from datetime import datetime
import pandas as pd
Recall the first few steps are to read the PCAP using Scapy and then loop through the file adding bytes and timestamps to lists. In Scapy, bytes are accessed with pkt.len and times are pkt.time. Times are in Unix Epoch, which I like to convert to a string using strftime so I can easily print them using pretty table or other tools.
#Read the packets from file
packets = rdpcap('example.pcap')
#Lists to hold packet info
pktBytes=[]
pktTimes=[]
#Read each packet and append to the lists.
for pkt in packets:
if IP in pkt:
try:
pktBytes.append(pkt[IP].len)
pktTime=datetime.fromtimestamp(pkt.time)
pktTimes.append(pktTime.strftime("%Y-%m-%d %H:%M:%S.%f"))
except:
pass
Next we start using Pandas. In Pandas the key element is a data frame. Our data frame is made of the bytes and time stamps. Bytes are a series creates from the list we created earlier. We do that by using pd.Series , with astype(int) so it will convert them as an int not a string.
#This converts list to series
bytes = pd.Series(pktBytes).astype(int)
You will then create the list of times to a Pandas datetime element. You will use to_datetime with the option “errors=coerce” to handle errors.
#Convert the timestamp list to a pd date_time
times = pd.to_datetime(pd.Series(pktTimes).astype(str), errors='coerce')
Now you create the dataframe with the elements.
#Create the dataframe
df = pd.DataFrame({"Bytes": bytes, "Times":times})
Then you will use the the element times as the index.
#set the date from a range to an timestamp
df = df.set_index('Times')
If you want to do a little trouble shooting you have some options. To print the data simply issue a print(df). Or issue a df.describe to see the types of data. I also usually do a print(df.tail()) to see just the last few lines of the data .
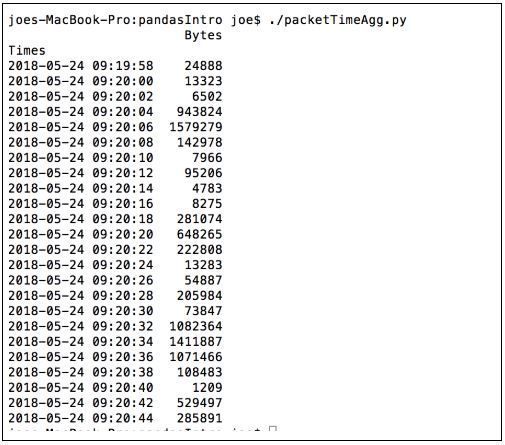
We still haven’t binned the data. To do that we will create a new dataframe with the option resample(timePeriod). This example bin’s the data in to 2 second bins summing the data. You can also take an average using .mean() .
#Create a new dataframe of 2 second sums to pass to plotly
df2=df.resample('2S').sum()
print(df2)
And just like before we will create a graph using plotly with the newly binned data.
#Create the graph
plotly.offline.plot({
"data":[plotly.graph_objs.Scatter(x=df2.index, y=df2['Bytes'])],
"layout":plotly.graph_objs.Layout(title="Bytes over Time ",
xaxis=dict(title="Time"),
yaxis=dict(title="Bytes"))})
Output:

The complete program looks like this:
#!/usr/bin/env python3 |
In conclusion, I hope you found this helpful. You can easily build from this on to more and more complex and unique programs to solve security and other IT problems. Since there was so much interest in this topic, I will follow up with one more complex model of data visualization in the next week. So stayed tuned for Part 4! Thanks for reading and please reach out if you have any questions.
About Automox
Facing growing threats and a rapidly expanding attack surface, understaffed and alert-fatigued organizations need more efficient ways to eliminate their exposure to vulnerabilities. Automox is a modern cyber hygiene platform that closes the aperture of attack by more than 80% with just half the effort of traditional solutions.
Cloud-native and globally available, Automox enforces OS & third-party patch management, security configurations, and custom scripting across Windows, Mac, and Linux from a single intuitive console. IT and SecOps can quickly gain control and share visibility of on-prem, remote and virtual endpoints without the need to deploy costly infrastructure.
Experience modern, cloud-native patch management today with a 15-day free trial of Automox and start recapturing more than half the time you're currently spending on managing your attack surface. Automox dramatically reduces corporate risk while raising operational efficiency to deliver best-in-class security outcomes, faster and with fewer resources.
)
)
)
)